Measuring the Impact of COVID-19 on Mental Health in Singapore using the BERT Model
Singapore is usually ranked amongst the top in the international indexes — from the world’s highest GDP per capita to life expectancy. Singaporeans have all the reasons to be happy. However, Singaporean are the unhappiest in the world with one of the highest rates of depression in Asia. The already poor mental health state of Singapore is exacerbated by the recent Covid-19 pandemic resulting in a surge in mental health issues since the 2020 Circuit Breaker. This project aimed to assess the emotional well-being of Singaporeans and examine how it has been affected by Covid-19.
To analyse this, three research topics were crafted:
- How has the general mood of Singaporeans varied over the last 10 years (2010-2020) and what are the key factors affecting it?
- Examine the impact of Covid-19 on emotion state in Singapore in 2020.
- Compare and understand the overall sentiment of Singapore and other countries due to Covid-19.
To understand the general mood of Singaporeans over the past decade, Twitter was used for data collection because users often express their emotions on the platform. To retrieve a representative spread of tweets over the 10-year span, the team used Twint API to draw ~1,000 random English tweets (excluding retweets) for each month from 2010 to 2020 and collected upwards of 120,000 tweets in total. The tweets drawn were geotagged with the location “SG” to ensure all tweets gathered are specific to Singaporean twitter users.
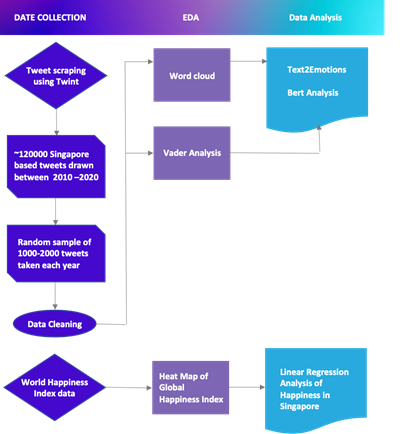
While the team initially collected tweets containing keywords such as “depression”, it was later realised that these tweets tend to carry negative sentiments and hence may possibly skew the analysis result. Eventually, no specific keywords or hashtags were used in the tweet collection process. Instead, the team drew a random sample of tweets for each month of the year to get a better representation of the overall annual sentiment on the ground. After collecting the raw data, data cleaning was performed to remove stop words, numbers, special characters followed by lemmatization.

VADER was initially used to classify the tweets to one of the three categories - positive, negative and neutral. However, it was found that VADER had a failure rate of ~40% when it comes to Singlish tweets. To overcome this, the team developed a Bidirectional Encoder Representations with Transformers (BERT) sentiment analysis model to increase the overall accuracy of our sentiment analysis (Fig 3). 2,500 tweets were labelled manually from a Singlish text corpus to train the BERT model to recognise Singaporean lingo and differentiate between first-person emotional sentiments from third-person statements. With that, the BERT model statement has an accuracy rate of 79.52%, allowing more precise analysis of users’ emotions. The BERT model was chosen because it can outperform other NLP techniques as it is trained to understand the sentiment of each word used in differing contexts instead of traditional static word embedding techniques.
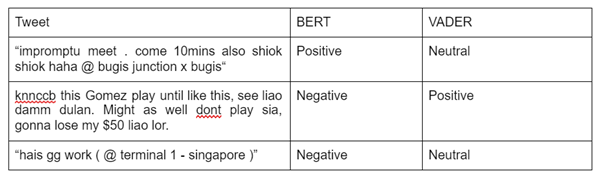
Figure 4 depicts the effectiveness of BERT sentiments classification compared to VADER, especially for tweets containing more Singlish terms. Terms such as “shiok”, “dulan” and “hais” are Singlish terms with strong positive or negative sentiments were picked up by the BERT model while VADER labelled them as neutral.

The bulk of the analysis was using the BERT model, while output from the VADER model was used as a cross-checking mechanism. Unsurprisingly, results showed that most of the tweets had neutral sentiments, hovering at an average of about 60%. Both positive and negative sentiments see averages of just under 20%. During the 2015-2017 period, there was a spike in the percentage of neutral tweets. In the following years from 2018 to 2020, the tweets became more polarised, as seen from the increase in percentage of tweets with positive and negative sentiments. Overall, no clear trends can be observed as positive and negative sentiments increased at the same time. We could infer that the onset of the COVID-19 pandemic induced both fear and distress in citizens but also brought Singaporeans together to spread positivity and encouragement during lockdown.
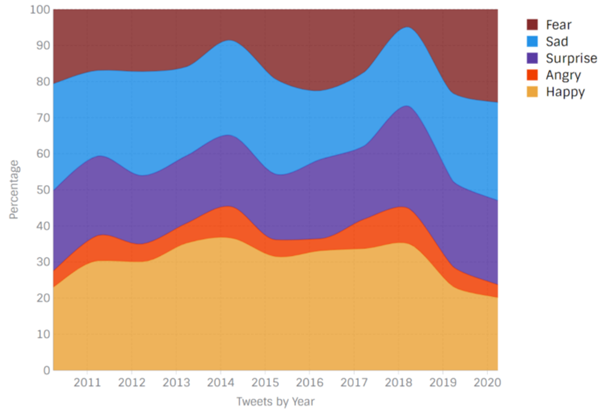
Text2Emotion analysis was used to better understand the spread of emotions within Singaporean tweets. We plotted a time series of the prevalence of all 5 emotions from 2010 to 2020 (Figure 6). On average, happiness has the highest prevalence throughout the years, averaging at about 25% of total tweets. Fear, sadness, and surprise all share a similar prevalence of about 20% while anger has the lowest prevalence at less than 10% on average. All emotions saw minor fluctuations throughout the years, with the main spike in happiness and simultaneous dip in fear in 2018. Towards 2019 and 2020, we observe a rise in the percentage of tweets containing fearful, sad, and surprised sentiments, which may be related to the COVID-19 pandemic. Secondary research confirms that lifestyle changes amid the pandemic has been associated with increased feelings of fear and sadness in 2020.
After understanding the general mood of Singaporeans, correlation analysis was conducted to understand contributing factors to the result. The World Happiness Report dataset collected by the United Nations between 2012 to 2020 was used as reference. Through telephone surveys, random respondents from each country were asked to rate their own current lives according to Cantril Ladder scale on various aspects as well as their happiness score (Figure 7).
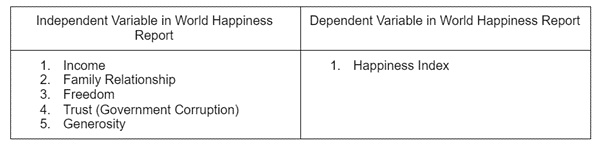
After understanding the general mood of Singaporeans, correlation analysis was conducted to understand contributing factors to the result. The World Happiness Report dataset collected by the United Nations between 2012 to 2020 was used as reference. Through telephone surveys, random respondents from each country were asked to rate their own current lives according to Cantril Ladder scale on various aspects as well as their happiness score (Figure 7).
Feel free to reach out to me at jdornel.2019@scis.smu.edu.sg to discuss the research findings of this project.