Measuring Healthcare Accessibility in
California Using the Gravity Model
Geographical Information Systems (GIS) has developed greatly in recent years, with software like ESRI's ArcGIS improving the analysis and visualisation of data using maps. Although there have been many studies to measure aspatial accessibility to healthcare in America, not much has been done in terms of geographical considerations.

As the old adage goes, “health is wealth”. The importance of health cannot be understated,
as not only is good health central to our well-being and quality of life, it is also an
important determinant of economic prosperity, as healthy populations leads to higher life
expectancies and greater work productivity, thus increasing their quantity and quality
of work and enabling them to contribute more to the economy.
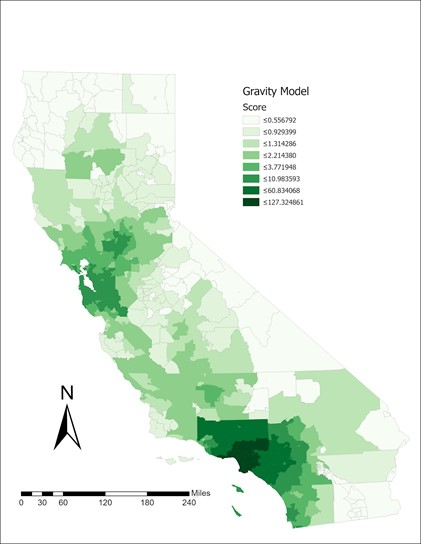
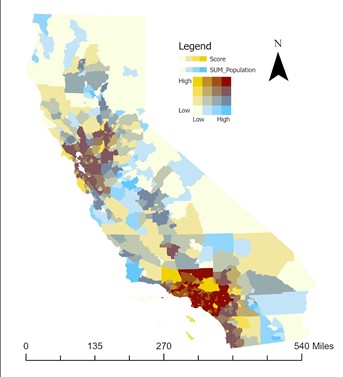
Geographical accessibility to healthcare services is variable across space and time, and is based on the relationship between the relative locations of healthcare facilities/location of healthcare professionals (supply) and the population residence locations (demand), which consequently determines the spatial gap between the supply and demand of healthcare resources. To measure this, various models have been proposed such as the kernel density estimation method or the Gravity Model, which was used for this project. There have been various approaches to the Gravity Model, with some using regression, a step function, an exponential function and various permutations coefficients simulating the distance decay effect. However, there is no widely regarded best way to account for this relationship with each mentioned approach having its own drawbacks. As a result, our group visualised the Gravity Model as seen through the first figure in green on top. With this in mind, we then conducted a bivariate analysis to identify hot and cold spots, as can be seen from the figure 2 below. The hot spots identified were mainly the San Diego, Los Angeles and San Fransisco areas. The cold spots identified were mainly in the San Joaquin Valley.
